This action will delete this post on this instance and on all federated instances, and it cannot be undone. Are you certain you want to delete this post?

JayVii posted Jun 6, 2024
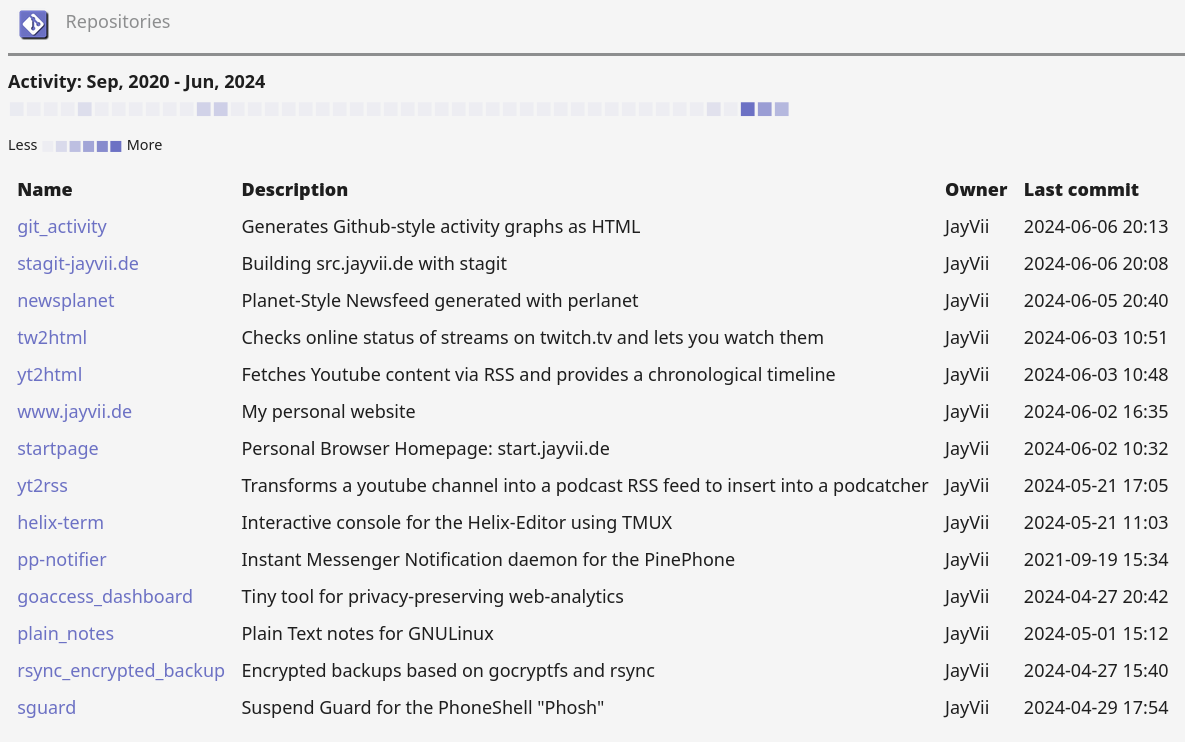
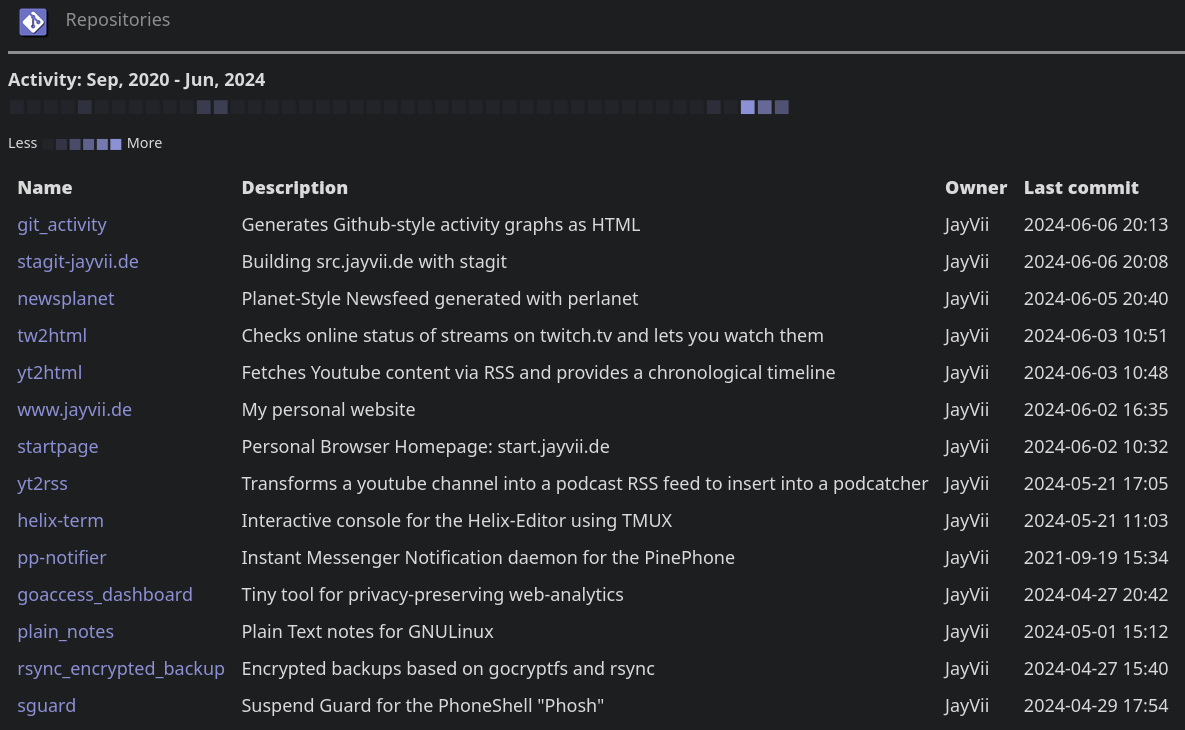
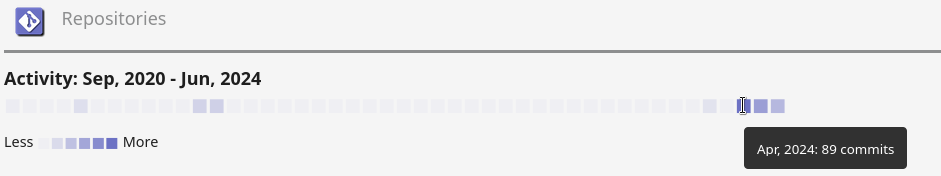
Wrote a simple #bash script that generates a #GitHub-style activity graph for my #stagit server under https://src.jayvii.de
I think it worked out quite nicely. Works quite well both in bright and dark themes :)
In case you want to try it or have suggestions how to improve it, please let me know: https://src.jayvii.de/pub/git_activity